By Shane Thomas, Global Digital Ag Lead
Successfully identifying the yield benefits of trials or the yield drags of specific issues such as herbicide drift, can have significant implications for your farm. Whether it’s to accurately understand the yield hit that a spray drift had on your bottom line or what fungicide had the best return on your farm – knowing exactly how much without any hassle can go a long way.
Some challenges to getting this kind of granular information is that we’ve had to use weigh wagons, grain carts or a real accurate eye on the yield monitor to know what occurred – and this was either inconvenient or burdensome. All of those still have a fit on the farm, but digital tools are coming to the rescue to help you more accurately assess what the yield and profitability dynamics are in specific areas of your field.
Farmers Edge Treatment Polygons power insights to help you better visualize, understand and measure the effects of your management decisions. Combined with the use of the CanPlug, our telematics device, we can geospatially plot what yield is occurring where on a Yield Map within the FarmCommand platform.
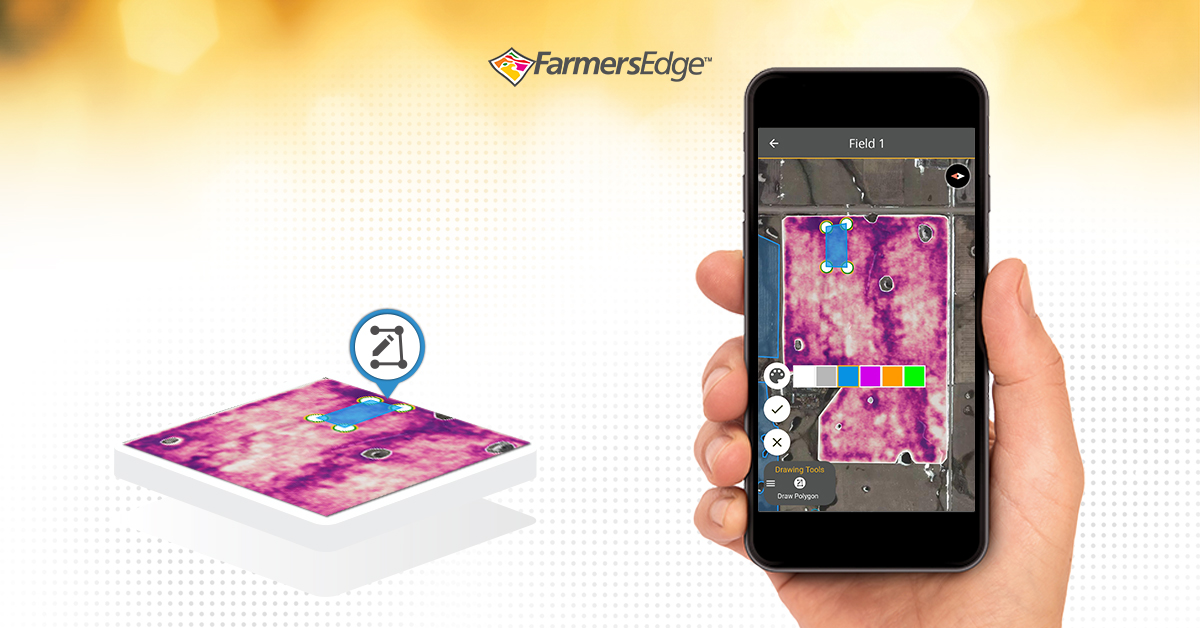
Using the Treatment Polygons from your desktop or your smartphone is easy. More specifically, it allows you to draw a shape – hexagon, square, triangle or any other random-sized shape so you can see exactly what that area of the field yielded at the end of the season.
If you are in a field inputting a fungicide trial, or see some area of concern, you can easily input a polygon on a smartphone. The polygon is saved to the cloud and is accessible for you to investigate later, to show to your agronomist, and fully assess once harvest is complete.
Additionally, Treatment Polygons provide assessments you can draw further insights from; whether you’ve acquired new land and want to understand it better or want to see how in-season NDVI imagery correlates to ultimate yield, you can draw polygons on any map within FarmCommand.
Too often I’ve talked with farmers who have real-time constraints that makes useful tools like trials simply not viable to do year in and year out. Now, with this tool, you can draw them in seconds, in real-time and not have to worry about addressing the trial until harvest is completed!
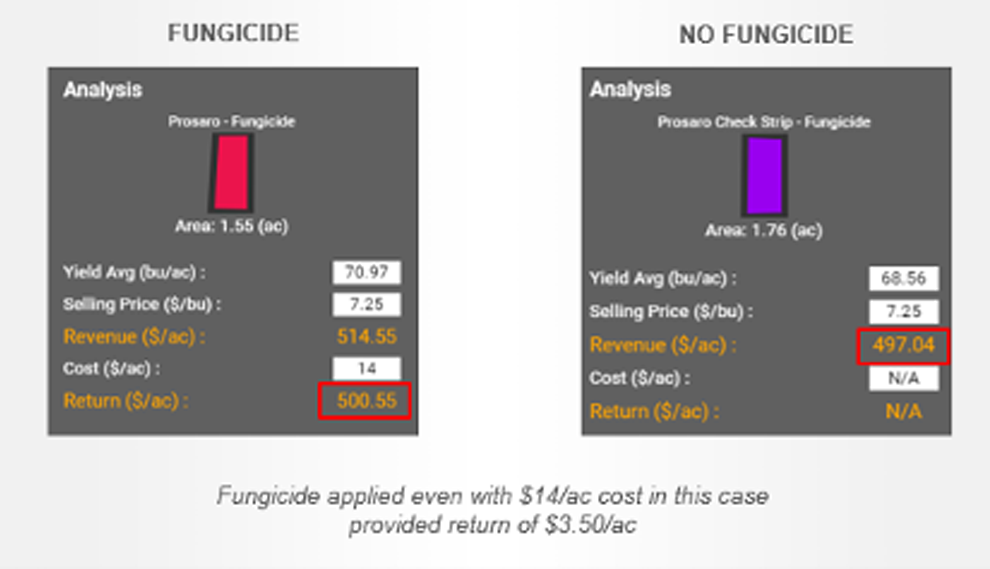
Treatment Polygons have built-in calculators so you can input the costs associated with the trial treatment to get an accurate breakdown of ROI and fine-tune your decisions for next season.
You no longer have to be afraid of trials and can test everything you want, ensuring you get the insight without the hassle.
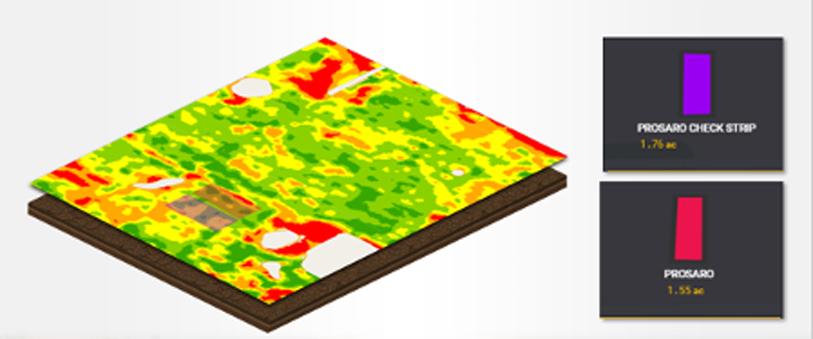
Example
In this example, you can see where a fungicide, Prosaro (pink rectangle), was treated on one area of the field to be compared to an untreated check strip (purple rectangle). You can also see what the size of the rectangle drawings are. The exact treatment areas were larger than ~1ac, but we used smaller polygons for simplicity’s sake.
After the season, you can input the selling price per bushel and the treatment cost into FarmCommand, and our ROI calculator will give you the economic breakdown – enabling you to know what products work or not and exactly how well.
To learn more about our Treatment Polygon, reach out to your local representative, or contact us here.