By Shane Thomas, Global Digital Ag Lead
For farmers, having a second set of eyes can be one of the most valuable assets on the farm, whether this is from an accountant, agronomist or grain merchandiser. One of the most common second opinions is the one coming from an agronomist in-season. With advancements in digital ag, there is another option for a different perspective, that can be used at any time, anywhere, giving an entirely different view than that of a consultant: in-season imagery. This is a bird’s eye view that can better enable you to identify problems in-season, in real-time.
Imagery has historically been challenging to use due to the infrequency of images and low-quality resolution. Farmers Edge has alleviated this with our use of Planet Imagery that takes images daily, gives farmers a useable image every two days on average and has a resolution of 3m!
We often use historical information to determine how to be better next year. With imagery, we can derive real-time insights that can advance outcomes in-season! The opportunity to see exactly what is happening in your fields can help you catch many different issues, including:
- Pest infestation – Catch pesky insect outbreaks like cutworms in season.
- Management errors early on – Catching issues where a drill didn’t get filled with fertilizer or spray misses in-season allows you to fix as best as possible while you can still increase yield.
- Weather impacts – Identify when a hail event wreaks havoc on your field in-season while you are at the lake or managing other issues on the farm.
- Long-term issues limiting yield – Compaction and salinity are just a couple of concerns that limit the growth of crops in-season. Imagery can catch these and direct you to an area to ground truth and test further.
- Save time and become more efficient – Plan and prioritize your day with the aid of imagery.
Now you are saying, how does an NDVI image help me do ALL of this? The simple answer? Regular imagery doesn’t, but Farmers Edge imagery does. Farmers Edge has created analytical tools that can bring regular NDVI imagery to life, becoming your right-hand man on the farm! Four imagery-derived map layers support all the above issues and more!
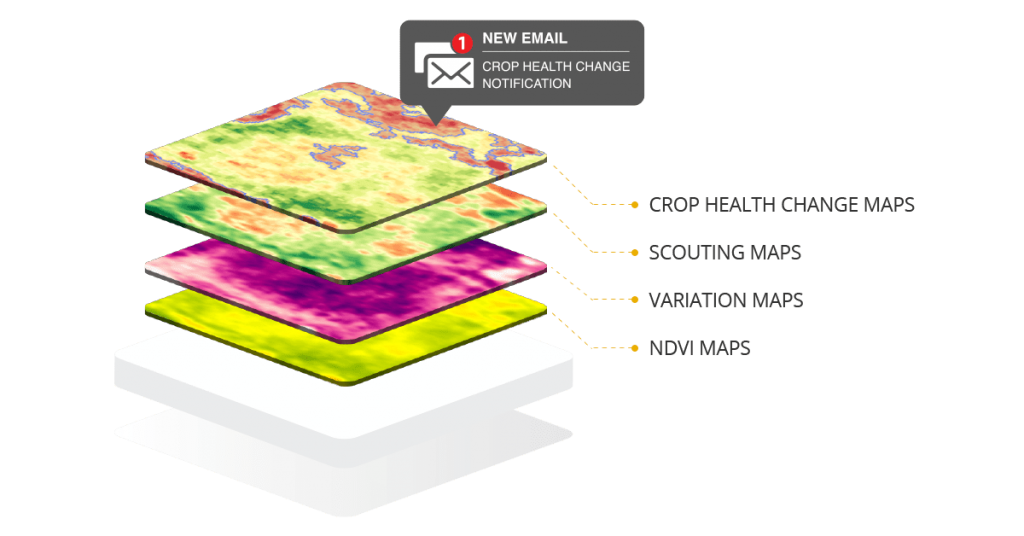
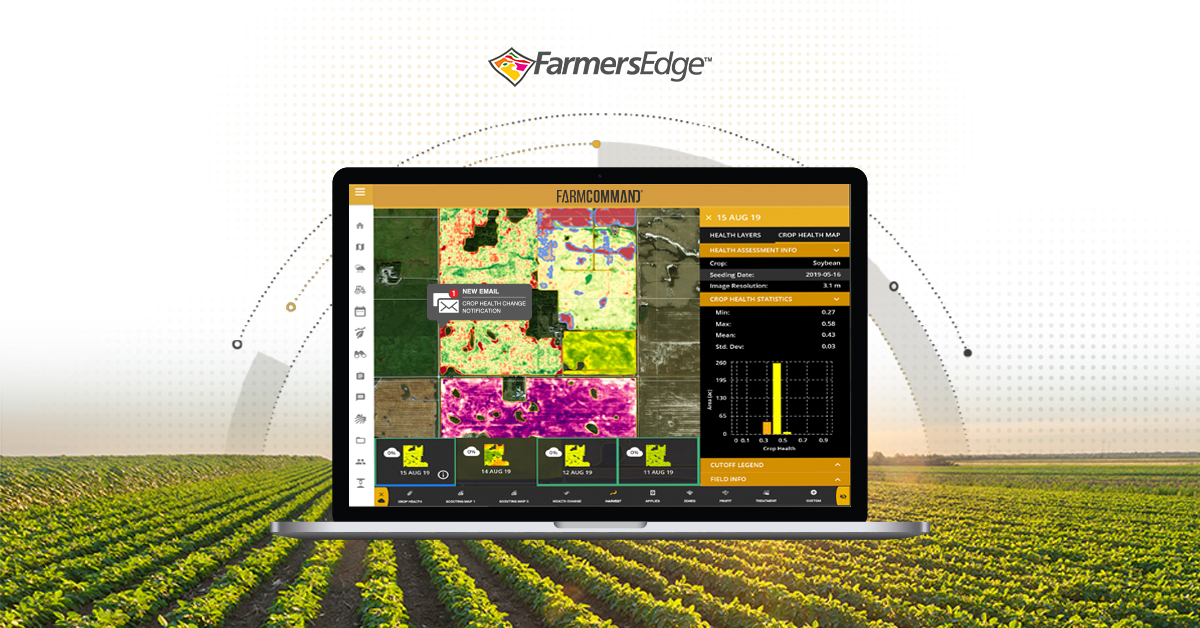
Crop Health Change Maps – The Cadillac of imagery is our crop health change maps. This tool was developed by our in-house team of geospatial and data scientists to give farmers insight into when specific areas of the field are changing disproportionately to the rest of the field. This imagery tool takes the most recent NDVI image and the current NDVI image and compares every area for NDVI reading. If a specific area is decreasing or increasing more than the average of the rest of the field, it outlines this on a map for your viewing and sends a notification directly to your email! The positive health change notifications have caught patches of resistant wild oats that farmers were able to eliminate that season before they spread further, but the negative health change notifications can catch even more. From insect pests to hail damage to spray drift and more, our crop health change notifications can be the second set of eyes that catch issues before they are even visible to the naked eye! Our customers and their agronomists have used this to plan and prioritize their day and weeks and helps to eliminate some unnecessary field visits or time spent in fields.
NDVI Maps – Depict a natural progression of the in-season vegetative health of your crops.
Variation Map – NDVI imagery is an excellent tool but doesn’t always catch every concern that occurs on the farm. With this in mind, Farmers Edge created variation maps that utilize different bands and spectrums from the satellites and analyzes it for variations in light reflectance. Our variation imagery catches subtle changes in leaf structure between varieties or even where there might be more standing water. Anything that changes the way light reflects off the crop. One of the most popular use cases? Catching nozzle issues in irrigation fields!
Scouting Maps – With regular NDVI imaging, you get very subtle hints at the good and bad areas of a field. Plain and simple, the green to yellow hue change is not highlighted as it could be. At Farmers Edge, we have created a Scouting Map layer that runs on top of the raw NDVI image and highlights the lush growth areas a deep green, the average mid-core areas a yellow and the poorest growth area an orange to red. This gives you a real “pop” effect when you view your imagery, showing exactly where a spray drift issues may have occurred! This can direct you to exactly where in the field you should be analyzing and assessing.
The power of our imagery cannot be understated; it can change how you manage your farm in-season. While there is still a necessity to visit your fields, you can be more strategic with where you visit and when you visit each area making you more efficient during a time where there are incredible demands on your time and attention!
For more information on Farmers Edge imagery, please reach out to your Farmers edge representative or contact us here.