By Shane Thomas, Global Digital Ag Lead
October signals two things for farmers: Analyzing the past year’s harvest and planning for next year’s seeding. As we get later into harvest and finishing harvest, it presents an excellent time for reflection on what worked or didn’t work in the last growing season and being able to consider what that means for decisions as planning for the next season commences.
While there are many different aspects to consider for planning, there are three specific topics that should take priority in the fall time period:
- Fertility Planning
- Varietal Selection
- Rotation Planning
These three considerations are instrumental to analyze and assess objectively in order to optimize input decisions and maximize profit for the following growing season.
What specifically needs to be analyzed to make better decisions and maximize profits?
Fertility Planning
Typically, nitrogen is the biggest crop input cost on the farm every year and one of the biggest drivers of crop yield. This means an emphasis on really assessing nitrogen needs is key to achieving better outcomes on your farm. To do this it means, not only understanding the variability within your field, but how much nitrogen to put down in a given area to achieve the best yields. Often this is difficult to truly understand, but can it be done?
Varietal Selection
Choosing a variety of any crop from canola to wheat is a big decision every year. All varieties have unique characteristics and traits that impact how they perform in a given geography. The crown jewel of crop traits is yield. With many seed varieties selling out early and needing to be booked in the fall to get, having a timely understanding of performance to make an informed decision is crucial. There are numerous variety trials done, but they are often filled with bias or aren’t near your farm operation, rendering their insights less relevant to your own operation. Is there a better way?
Rotation Planning
There is lots to consider with rotation, from herbicide residual, to disease potential to trash management to long-term sustainability. Lots goes into this decision, but ultimately the goal is to find the rotation that optimizes both long-term sustainability and yield in the coming year. This decision is often based on what was done in the past, what is typical in an area or gut feelings based on anecdotal notes from the past. Can we utilize data to ensure we make a rotational decision that has the best interests of the farm in the short and long term?
What is Benchmarking?
Benchmarking is defined as:
“to evaluate or check (something) by comparison with a standard”
Farmers Edge benchmarking enables farmers the ability to see how a specific product or practice performs across the entirety of a data set. Now, when it comes to making plans for the upcoming year you have a first step: checking out the benchmark function in FarmCommand.
FarmCommand Advanced Benchmarking
Farmers Edge is armed with terrabytes of aggregated data that enables us to understand what practices produce the most profitable outcomes for farm operations. This data has allowed us to create a simple to use, functional tool that can pull back the curtain around what practices produce the best yields, in specific geographies.
Benchmarking in Action: Three Examples
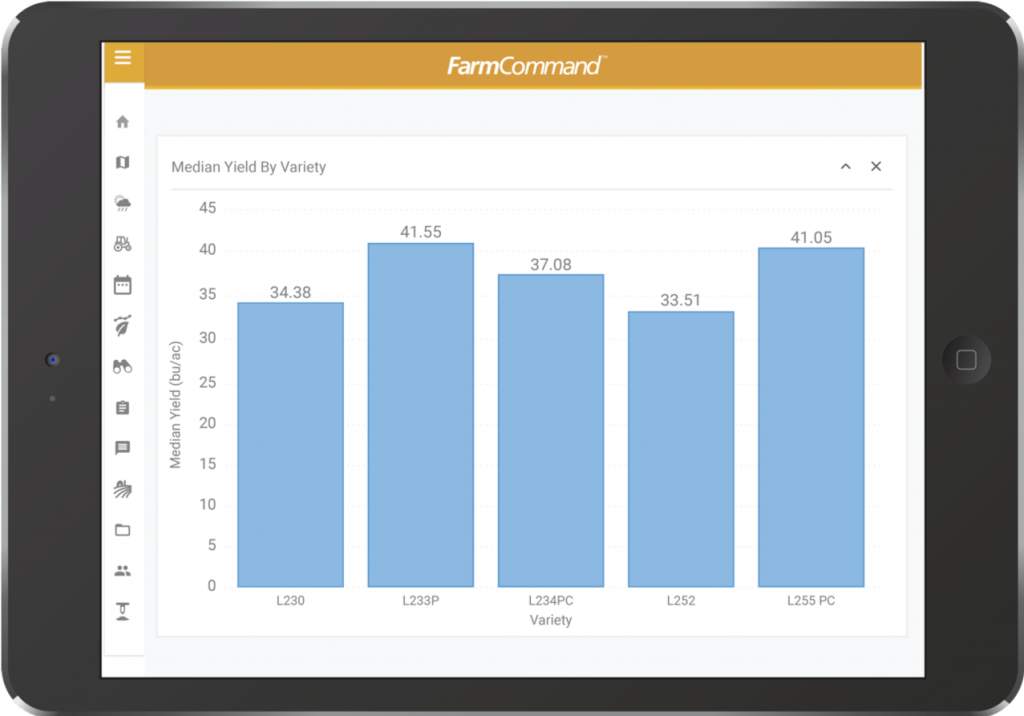
Varietal Selection – A popular benchmark is looking at the average yields of all canola varieties grown across a given geography, identifying the highest to lowest yielders across the data set for that given year, or across the last 3 years if desired. This empowers you as a farmer to make an informed decision, knowing what varieties offer the best chance of success for you or which varieties to dig further into. Having this information in your hands allows you to not only identify top choices but gives you the opportunity to secure those varieties early with your crop input supplier before they sell out.
Rotation – If you know that you are going to grow in 2020 within your canola, wheat and soy rotation you can begin to assess if any rotational changes need to be made and begin thinking about what crops can go on which pieces of land. The Benchmarking function allows you to compare how canola performs on various stubble. As you can see below in our teaser data from western Manitoba, canola on soybean stubble produced stronger yields than canola on wheat stubble. Assuming other rotational considerations check out, it could be a practice worth looking into.
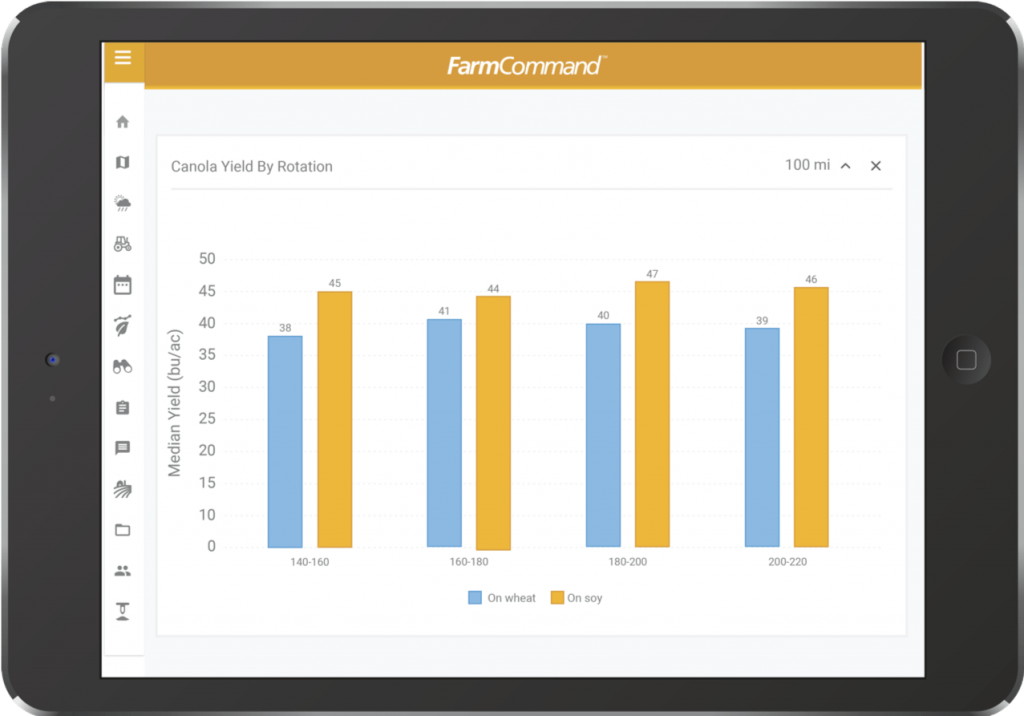
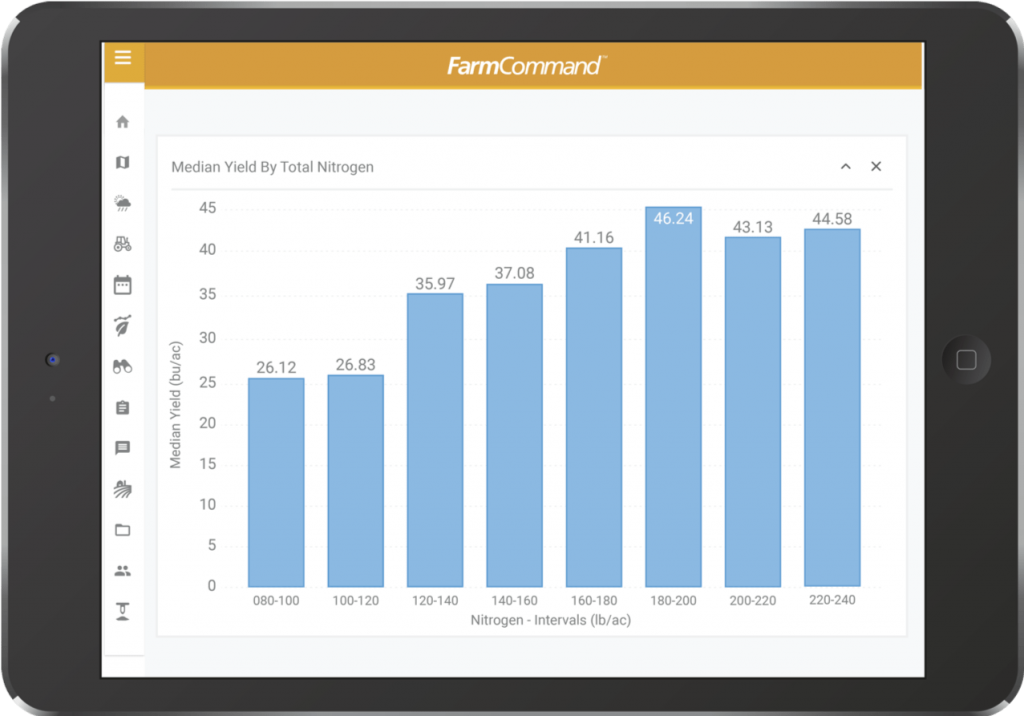
Fertility – Nitrogen rate is one of the biggest decisions made each year. How much to put down and where? With benchmarking we can see what total rates of nitrogen are producing the best yields in various crops. Did you give your canola crop access to only 140lbs of Nitrogen this year? Our early data indicates that the highest profiting canola had access to between 180lbs and 200lbs of Nitrogen! Wow! To top this off, we know that nitrogen prices historically are the best price in fall; knowing what rates of nitrogen you will put down in the 2020 season will not only help you optimize yield but manage input costs.
The ability to leverage data instead of going off of gut decisions will allow you to achieve more within your operation. Benchmarking is just the start of what data can do for you within your farm. Talk to one of our Farmers Edge experts to learn more!

